
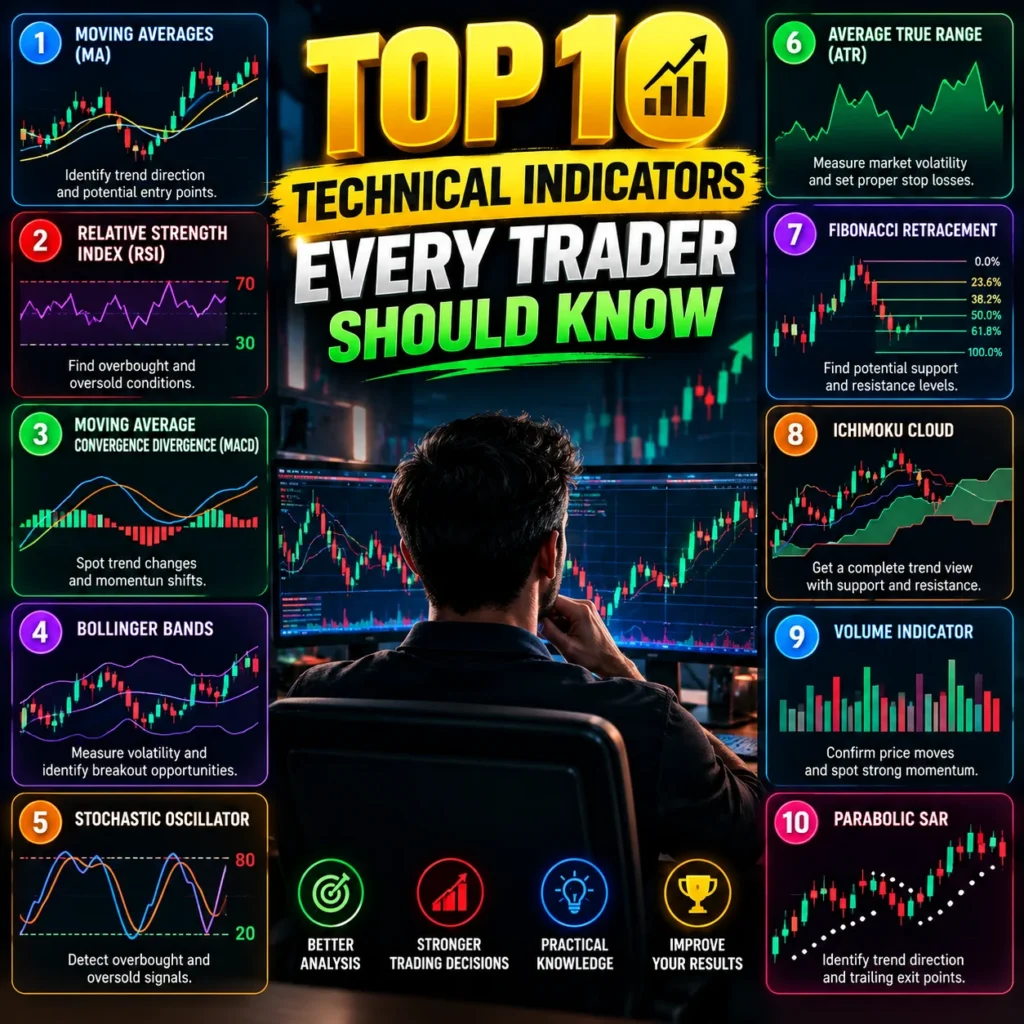
Technical analysis helps traders study market behavior by analyzing price movements, trends, momentum, and trading volume. One of the most important parts of technical analysis is learning how to use technical indicators for trading.
Trading indicators are mathematical calculations based on market data such as price, volume, and sometimes open interest. They can help traders identify trends, measure momentum, spot potential reversals, and confirm trading decisions.
However, no indicator can predict the market with complete accuracy. The best technical indicators are most useful when they are combined with price action, support and resistance, market structure, and proper risk management.
In this guide, we explore 10 popular technical indicators every trader should understand.
What Are Technical Indicators?
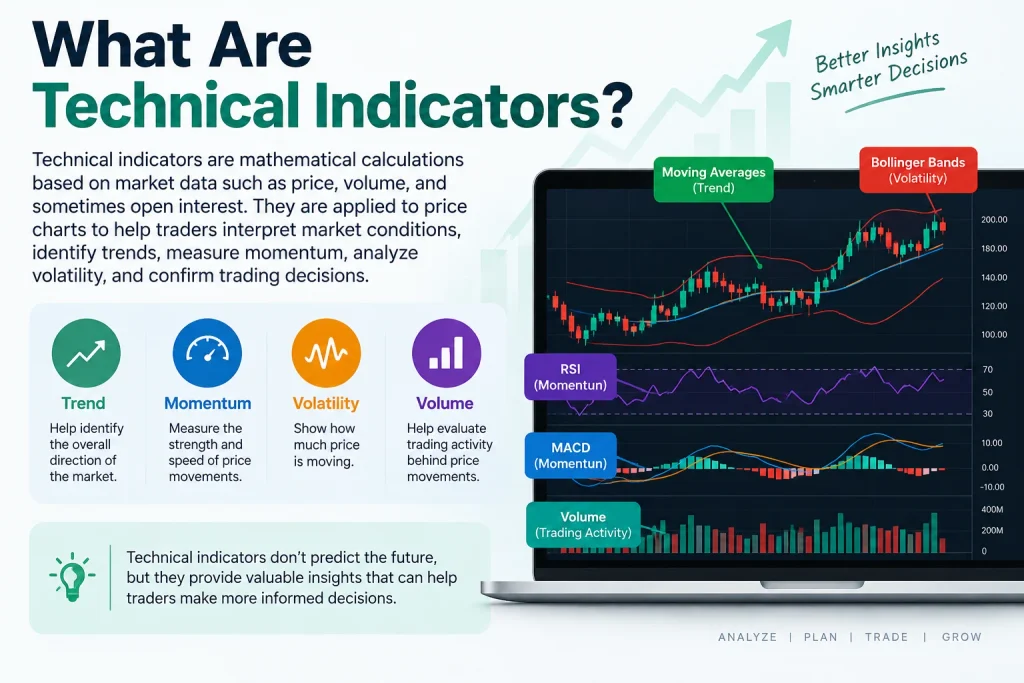
Technical indicators are tools applied to price charts to help traders interpret market conditions. Depending on the indicator, they may provide information about trend direction, momentum, volatility, or volume.
Instead of relying only on visual observations, indicators transform historical market data into information that may be easier to interpret.
Technical indicators are commonly divided into several categories:
- Trend indicators help identify the overall direction of the market.
- Momentum indicators measure the strength and speed of price movements.
- Volatility indicators show how much price is moving.
- Volume indicators help evaluate trading activity behind price movements.
The right indicator depends on your trading strategy, timeframe, and the market you are analyzing.
1. Moving Averages (SMA and EMA)
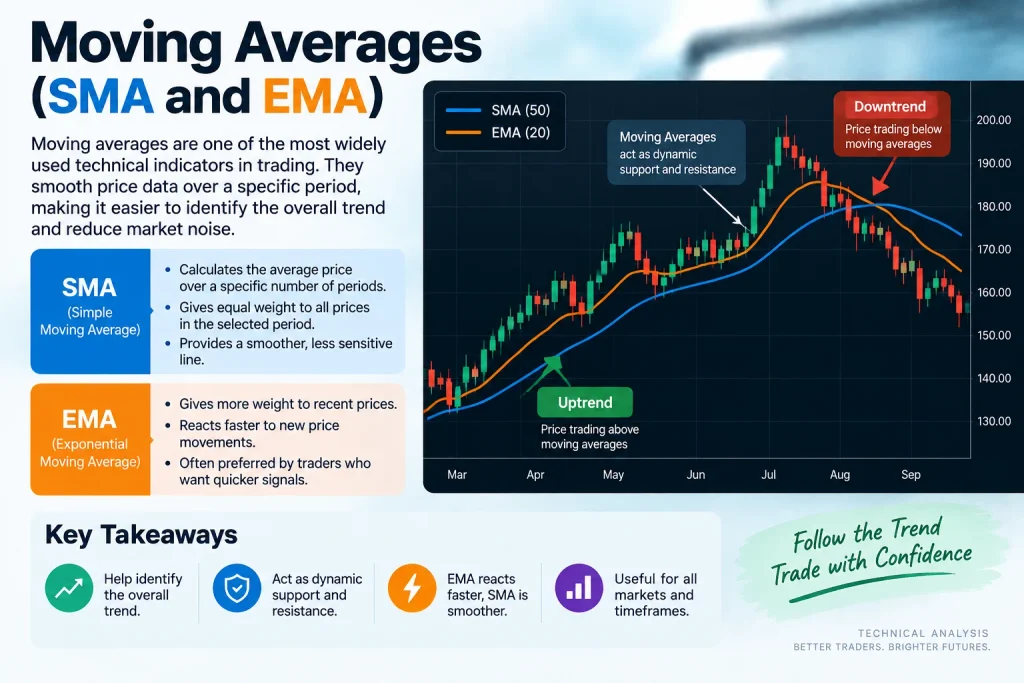
Moving averages are among the most widely used technical indicators in trading. They smooth price data over a selected period, making the underlying trend easier to identify.
The two common types are the Simple Moving Average (SMA) and Exponential Moving Average (EMA).
An SMA calculates the average price over a specific number of periods. An EMA gives greater weight to recent prices, which means it generally reacts faster to new price movements.
For example, traders may use the 50-day and 200-day moving averages to examine longer-term market trends. Shorter moving averages, such as the 9-period or 20-period EMA, may be used for shorter-term analysis.
Moving averages can help traders identify trend direction, dynamic support and resistance, and potential crossover signals.
2. Relative Strength Index (RSI)
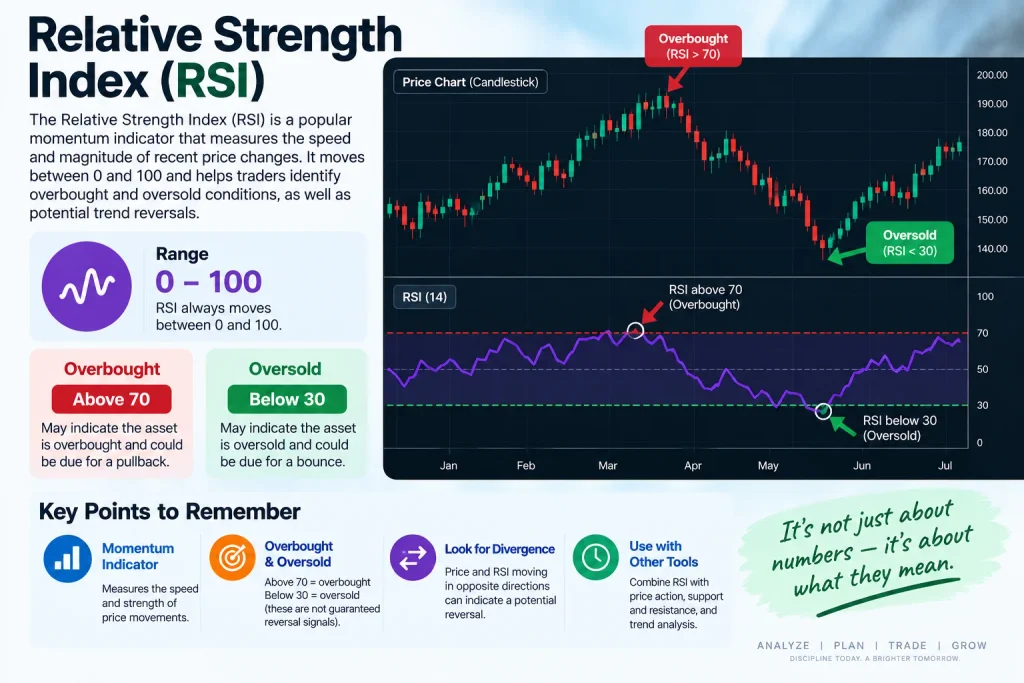
The Relative Strength Index (RSI) is a popular momentum indicator developed by J. Welles Wilder Jr.
RSI moves between 0 and 100 and measures the speed and magnitude of recent price changes.
Traditionally, an RSI reading above 70 is considered overbought, while a reading below 30 is considered oversold.
However, traders should avoid assuming that an overbought market must immediately fall or an oversold market must immediately rise. Strong trends can keep RSI at extreme levels for extended periods.
Traders also use RSI to analyze momentum and look for divergence between price and the indicator.
3. MACD (Moving Average Convergence Divergence)
The MACD is another widely followed momentum and trend indicator.
MACD typically consists of three components:
- MACD line
- Signal line
- Histogram
The indicator measures the relationship between two exponential moving averages. Traders often watch for crossovers between the MACD line and signal line.
When the MACD line moves above the signal line, it may indicate increasing bullish momentum. When it moves below the signal line, it may indicate increasing bearish momentum.
The histogram provides a visual representation of the difference between the two lines.
Like other trading indicators, MACD should be interpreted in the context of the broader market rather than treated as an automatic buy or sell signal.
4. Bollinger Bands
Bollinger Bands are a volatility indicator developed by John Bollinger.
They normally consist of three lines: a middle moving average, an upper band, and a lower band. The outer bands expand and contract according to market volatility.
When volatility increases, the bands generally widen. When volatility decreases, they tend to narrow.
Traders use Bollinger Bands to study volatility, identify periods of price compression, and understand where price is trading relative to its recent range.
A touch of the upper or lower band does not automatically mean that price will reverse. During strong trends, price can continue moving close to one band for a considerable period.
5. Stochastic Oscillator
The Stochastic Oscillator is a momentum indicator that compares a market’s closing price with its recent price range.
It normally moves between 0 and 100.
Readings above 80 are traditionally viewed as overbought, while readings below 20 are viewed as oversold.
The indicator contains two lines, commonly known as %K and %D. Traders may study their crossovers, momentum shifts, and divergences.
The Stochastic Oscillator can be particularly useful for analyzing momentum within trading ranges, although market context remains important.
6. Average True Range (ATR)
The Average True Range (ATR) is designed to measure market volatility rather than market direction.
A higher ATR generally indicates greater volatility, while a lower ATR indicates reduced volatility.
This makes ATR useful for traders who want to understand how much a market is moving during a particular period.
ATR may also be incorporated into risk-management techniques. For example, some traders use multiples of ATR when determining stop-loss distances because it allows them to consider current market volatility.
Importantly, ATR does not tell traders whether price will rise or fall. It measures the magnitude of price movement.
7. Average Directional Index (ADX)
The Average Directional Index (ADX) is used to evaluate the strength of a market trend.
Unlike some trend indicators, ADX focuses primarily on trend strength, not whether the market is moving upward or downward.
ADX readings are generally interpreted on a scale from 0 to 100. Higher readings suggest a stronger trend, while lower readings may indicate weak or range-bound market conditions.
ADX is often used together with the +DI and -DI directional indicators.
For traders who use trend-following strategies, ADX can provide additional information about whether current market conditions are strongly trending or relatively directionless.
8. On-Balance Volume (OBV)
On-Balance Volume (OBV) is a volume-based technical indicator.
It attempts to measure buying and selling pressure by adding volume when price closes higher and subtracting volume when price closes lower.
Instead of focusing only on the absolute OBV number, traders often pay attention to its direction.
For example, if both price and OBV are rising, volume may be supporting the upward price movement. If price reaches new highs while OBV fails to confirm the move, traders may investigate the divergence more closely.
OBV demonstrates why volume can be an important part of technical analysis.
9. Commodity Channel Index (CCI)
The Commodity Channel Index (CCI) is a momentum oscillator developed by Donald Lambert.
Despite its name, CCI is not limited to commodities. It can be applied to different financial markets.
CCI measures how far the current price has moved from its statistical average.
Readings above +100 may indicate strong positive momentum, while readings below -100 may indicate strong negative momentum. Traders can also examine CCI for potential divergences and momentum changes.
As with RSI and other oscillators, extreme readings should not automatically be interpreted as reversal signals.
10. Parabolic SAR
The Parabolic Stop and Reverse (Parabolic SAR) is a trend-following indicator developed by J. Welles Wilder Jr.
On a chart, it normally appears as a series of dots positioned above or below price.
Dots below price generally indicate an upward trend, while dots above price generally indicate a downward trend.
When the dots change position from one side of price to the other, it may indicate a possible change in trend direction.
Parabolic SAR tends to be more useful in clearly trending markets. In sideways or highly choppy markets, it can generate frequent changes and potentially misleading signals.
Which Are the Best Technical Indicators for Trading?
There is no single indicator that is best for every trader, market, or trading strategy.
Instead of searching for one perfect indicator, traders can consider combining indicators that measure different aspects of the market.
For example, a trader might use a moving average to identify the trend, RSI to evaluate momentum, and ATR to understand volatility.
Using several indicators that measure the same thing can create unnecessary duplication. For example, combining multiple momentum oscillators may provide similar information rather than independent confirmation.
The goal should be to build a clear trading framework rather than fill a chart with indicators.
How to Combine Trading Indicators Effectively
Technical indicators can become more useful when combined with other forms of technical analysis.
A trader might first determine the overall trend using market structure and moving averages. Support and resistance levels can then highlight important price areas. RSI or MACD may provide additional information about momentum, while volume indicators can help assess participation behind a move.
This approach creates confluence, where several independent pieces of information support a trading idea.
However, confluence does not guarantee a successful trade. Risk management remains essential because every technical setup can fail.
Common Mistakes When Using Technical Indicators
One common mistake is using too many indicators at the same time. A chart filled with numerous signals can make decision-making more difficult rather than easier.
Another mistake is treating an indicator signal as a guaranteed prediction. Technical indicators are primarily calculated from historical and current market data. They cannot know with certainty what price will do next.
Traders should also avoid constantly changing indicator settings simply to make past charts look more profitable. This can lead to overfitting and unrealistic expectations.
Testing a strategy across different market conditions can provide a better understanding of how an indicator behaves.
Final Thoughts
The best technical indicators are tools that help traders understand what is happening in the market rather than tools that guarantee future price movements.
Moving averages can help identify trends, RSI and MACD can provide information about momentum, Bollinger Bands and ATR can help analyze volatility, while indicators such as OBV can provide insights into volume.
Learning what each indicator measures—and understanding its limitations—is more important than simply looking for buy and sell signals.
Technical analysis becomes more structured when indicators are combined carefully with price action, market structure, support and resistance, and disciplined risk management.
For traders who want to develop a deeper understanding of chart analysis, exploring detailed technical analysis trading eBooks can provide additional examples, strategies, and practical explanations for applying these concepts across different market conditions.
Educational content only. This article does not constitute financial or investment advice. Trading involves risk, and past market behavior does not guarantee future results.