
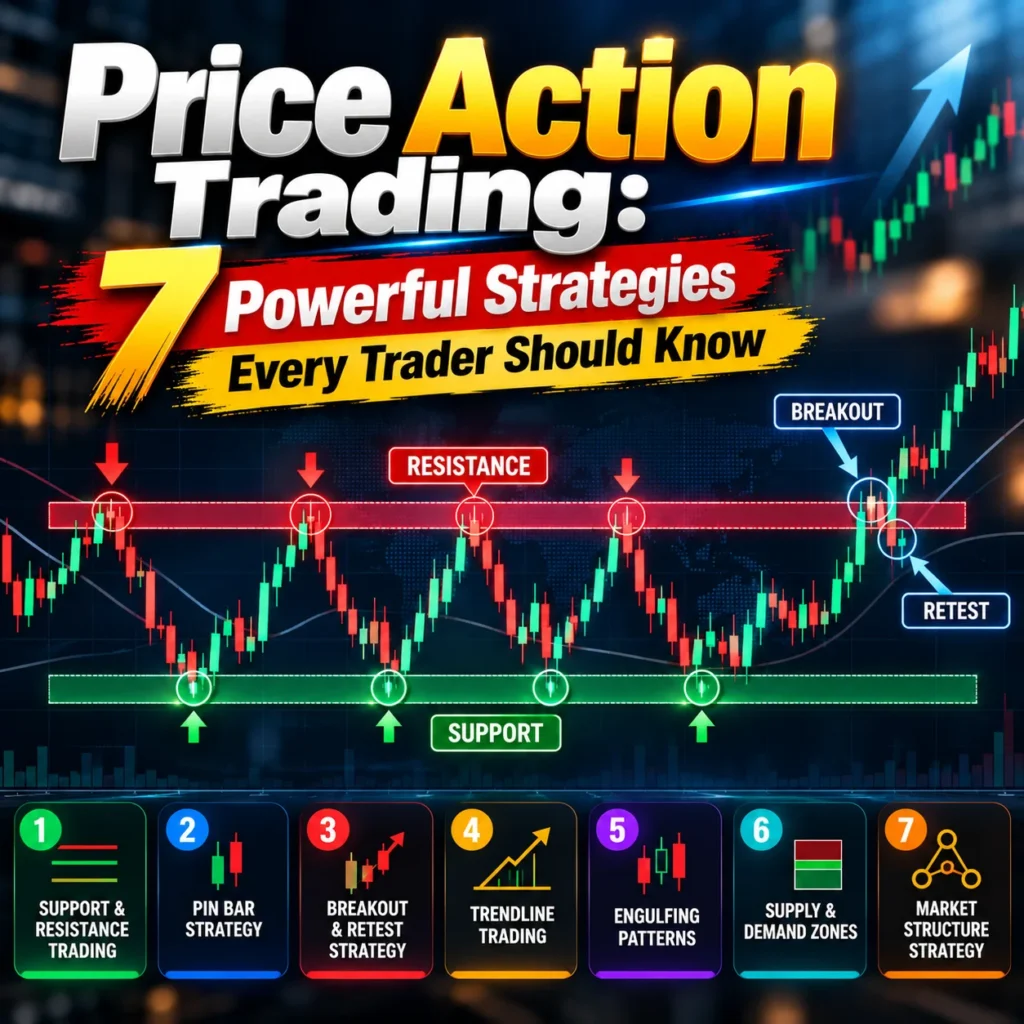
Have you ever looked at a trading chart and wondered why prices suddenly reverse, break through important levels, or move strongly in one direction?
The answer often lies in understanding price action trading.
Price action trading is one of the most widely used approaches to technical analysis. Instead of relying heavily on complicated indicators, traders study price movements, candlestick patterns, market structure, and important support and resistance levels to make trading decisions.
Whether you trade Forex, Gold, Cryptocurrency, or Stocks, learning how to read price action can help you better understand market behavior.
In this guide, we’ll explore seven practical price action trading strategies, explain how they work, and discuss common mistakes that beginners should avoid.
What Is Price Action Trading?
Price action trading is a method of analyzing financial markets by studying historical and current price movements.
Traders use price charts to identify patterns, trends, and potential trading opportunities without depending entirely on technical indicators.
The main elements of price action trading include:
- Candlestick patterns
- Support and resistance levels
- Market structure
- Trend identification
- Breakouts and retests
- Supply and demand zones
- Price rejection and momentum
For example, when the price of Gold approaches a previously tested resistance level, traders may watch how candlesticks behave around that area.
If buyers repeatedly fail to push the price higher, this could indicate selling pressure.
However, price action patterns are not guarantees. Market conditions, liquidity, volatility, and unexpected news can influence price movements.
Why Is Price Action Trading Important?
Many traders prefer price action because it focuses directly on what the market is doing.
Technical indicators such as moving averages, RSI, and MACD are calculated using price or volume data. Price action traders often prefer to examine the underlying chart before using additional indicators.
Benefits of Price Action Trading
1. Simple Chart Analysis
Price action strategies can be applied using relatively clean charts without numerous indicators.
2. Applicable to Multiple Markets
The same general principles can be studied in Forex, Stocks, Gold, Indices, and Cryptocurrency markets.
3. Better Understanding of Market Structure
Analyzing price swings helps traders recognize trends, consolidation periods, and potential reversals.
4. Flexible Across Timeframes
Price action can be studied on intraday, daily, and weekly charts.
5. Supports Risk Management
Important price levels can help traders identify logical areas for stop-loss placement and trade invalidation.
Although price action is useful, successful application requires practice, patience, and disciplined risk management.
7 Powerful Price Action Trading Strategies
1. Support and Resistance Trading Strategy
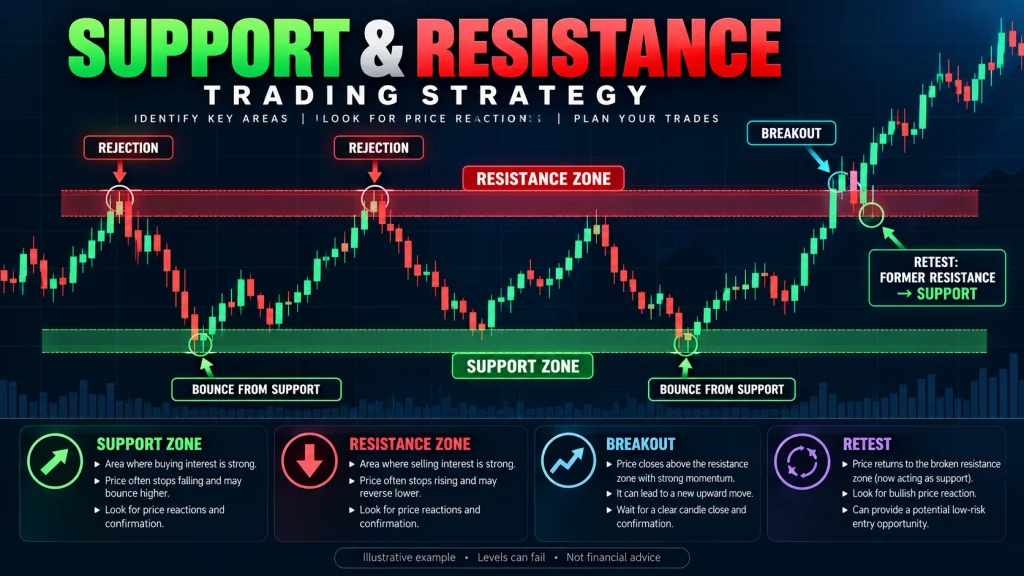
Support and resistance are fundamental concepts in price action trading.
Support is an area where buying interest has previously been strong enough to slow or reverse a decline.
Resistance is an area where selling interest has previously slowed or reversed an upward move.
How This Strategy Works
Imagine EUR/USD repeatedly falls toward a particular price level before moving upward.
Traders may identify this region as a potential support zone.
When the price approaches the same area again, they observe candlestick behavior to determine whether buyers are responding.
Steps to Identify Opportunities
- Open a price chart.
- Identify areas where price previously reversed.
- Mark important support and resistance zones.
- Wait for price to revisit a zone.
- Look for confirmation through price behavior.
- Plan the trade with a predefined stop-loss and target.
link of Book: Click Here
Important Trading Tip
Support and resistance should generally be treated as zones rather than exact prices.
A temporary movement beyond a level does not automatically mean the level has permanently failed.
Best for: Beginners learning chart analysis, swing traders, and traders studying range-bound markets.
2. Pin Bar Candlestick Strategy
A pin bar is a candlestick with a relatively small body and a long wick.
It can indicate that the market attempted to move in one direction but experienced strong opposition.
Bullish Pin Bar
A bullish pin bar typically has a long lower wick.
It suggests that sellers pushed the price downward before buyers moved it back toward the upper portion of the candle.
Bearish Pin Bar
A bearish pin bar typically has a long upper wick.
It suggests that buyers pushed prices higher before sellers forced them downward.
How Traders Use Pin Bars
Traders often look for pin bars near:
- Important support zones
- Major resistance zones
- Trendlines
- Previous swing highs or lows
- Established supply and demand areas
A pin bar appearing at a meaningful price level may provide more useful context than one appearing randomly in the middle of a trading range.
However, a single candlestick does not reliably predict the next market movement.
Best for: Traders studying price rejection and potential market reversals.
3. Breakout and Retest Trading Strategy
The breakout and retest strategy is a popular method of analyzing how prices behave around important market levels.
A breakout occurs when the price moves beyond an established support or resistance zone.
A retest occurs when the price returns toward the broken level.
Example
Suppose Gold has been trading below a resistance zone.
Eventually, buyers push the price above that resistance.
Instead of entering immediately, some traders wait for the price to return toward the breakout area.
If the previous resistance begins acting as support, traders may interpret this as evidence that the breakout is holding.
Basic Strategy Process
Step 1: Identify an important resistance or support zone.
Step 2: Wait for a convincing breakout.
Step 3: Observe whether price returns to the broken zone.
Step 4: Look for confirmation that the level is holding.
Step 5: Define entry, stop-loss, and profit-target conditions before trading.
Common Mistake
Entering immediately after every breakout can expose traders to false breakouts.
Sometimes prices move beyond a level temporarily before reversing sharply.
Waiting for additional confirmation can help traders evaluate the setup, although it cannot eliminate false signals.
Best for: Forex, Gold, Cryptocurrency, and Stock traders analyzing trending markets.
4. Trendline Trading Strategy
Trendlines help traders visualize the direction of market movements.
An upward trendline connects important rising swing lows.
A downward trendline connects important falling swing highs.
How to Identify an Uptrend
An uptrend typically contains:
- Higher highs
- Higher lows
- Sustained upward price movement
During an uptrend, traders may watch for pullbacks toward an established trendline or support zone.
How to Identify a Downtrend
A downtrend typically contains:
- Lower highs
- Lower lows
- Sustained downward price movement
During a downtrend, traders may look for signs of selling pressure near resistance or a descending trendline.
Important Consideration
Trendlines are subjective.
Different traders may draw them slightly differently, and a trendline touch alone is not sufficient evidence for a trade.
Trendlines are generally more useful when combined with market structure and other price action observations.
Best for: Trend-following traders and swing traders.
5. Engulfing Candlestick Strategy
An engulfing pattern consists of two candles, with the second candle’s real body covering the previous candle’s real body.
There are two commonly discussed variations.
Bullish Engulfing Pattern
A bullish engulfing pattern occurs when a bullish candle’s real body engulfs the preceding bearish candle’s real body.
It may indicate increasing buying pressure.
Bearish Engulfing Pattern
A bearish engulfing pattern occurs when a bearish candle’s real body engulfs the preceding bullish candle’s real body.
It may indicate increasing selling pressure.
How to Use Engulfing Patterns
Traders can examine engulfing patterns around:
- Strong support levels
- Strong resistance levels
- Pullbacks within established trends
- Potential market reversal areas
For example, a bullish engulfing candle forming near an important support zone may suggest buyers are becoming more active.
However, the reliability of any engulfing pattern depends on the surrounding market context.
Best for: Traders learning candlestick analysis and potential reversal setups.
6. Supply and Demand Zone Strategy
Supply and demand trading focuses on price areas where significant buying or selling activity may have occurred.
Demand Zones
Demand zones are areas where strong buying activity previously accompanied an upward price movement.
When price returns to these areas, traders may monitor whether buying pressure appears again.
Supply Zones
Supply zones are areas where strong selling activity previously accompanied a downward price movement.
When price revisits these areas, traders may watch for renewed selling pressure.
How to Identify Supply and Demand Zones
Look for:
- Areas where price consolidated before a strong move.
- Sharp upward or downward movements.
- Previous price reactions around the same region.
- The broader trend and market structure.
Supply and demand zones are estimates based on observable price behavior. A chart alone cannot confirm the exact volume of unfilled institutional orders at a particular level.
Best for: Intermediate traders interested in market structure and institutional trading concepts.
7. Market Structure Trading Strategy
Market structure trading focuses on understanding the sequence of price highs and lows.
It helps traders evaluate whether the market is trending, ranging, or potentially changing direction.
Bullish Market Structure
A bullish structure generally consists of higher highs and higher lows.
This suggests buyers have been able to push prices progressively upward.
Bearish Market Structure
A bearish structure generally consists of lower highs and lower lows.
This suggests sellers have been able to push prices progressively downward.
Break of Structure (BOS)
A break of structure occurs when price moves beyond a significant previous swing point in a manner consistent with the prevailing trend.
Traders may interpret this as a sign of trend continuation.
Change of Character (CHoCH)
A change of character is a concept used in some market structure methodologies to describe a potential shift in price behavior.
For example, a market producing higher highs and higher lows may begin showing weakness after breaking a significant previous higher low.
However, definitions of BOS and CHoCH vary across trading methodologies.
A structural break does not guarantee a trend reversal.
Best for: Traders interested in advanced price action, Smart Money Concepts, and ICT-style market analysis.
How to Build a Price Action Trading Plan
Learning individual strategies is only the beginning.
A structured trading plan helps traders evaluate opportunities consistently.
Step 1: Choose Your Market
Start by focusing on one market.
For example:
- EUR/USD
- GBP/USD
- Gold (XAU/USD)
- Bitcoin
- Major stock indices
Each market has different volatility, liquidity, and trading characteristics.
Step 2: Identify the Market Trend
Study the overall market structure.
Ask yourself:
Is the market moving upward, downward, or sideways?
Understanding the broader direction can help you interpret individual price patterns.
Step 3: Mark Important Price Levels
Identify:
- Support and resistance zones
- Previous swing highs and lows
- Potential supply and demand areas
- Important breakout levels
Avoid drawing so many levels that the chart becomes difficult to interpret.
Step 4: Wait for a Clear Setup
Choose one or two price action strategies and define their conditions.
For example, you might study bullish engulfing patterns near established support zones during an uptrend.
Avoid entering trades simply because a candle looks interesting.
Step 5: Manage Your Risk
Before entering a trade, determine:
- Your planned entry price
- Your stop-loss level
- Your potential profit target
- The maximum amount you are willing to lose
A commonly discussed risk-management approach is limiting the amount risked on an individual trade to a small percentage of trading capital.
However, no fixed percentage is appropriate for everyone. Position size should reflect personal circumstances, market volatility, and the possibility of losses.
Step 6: Record Your Results
Maintain a trading journal.
Record the strategy, market conditions, entry reasoning, stop-loss placement, outcome, and lessons learned.
Reviewing a sufficient number of trades can help identify recurring mistakes and evaluate whether a strategy has demonstrated a measurable advantage after costs.
Common Price Action Trading Mistakes
Even experienced traders can make mistakes when analyzing price movements.
Here are five common problems to avoid.
1. Trading Every Candlestick Pattern
Not every pin bar or engulfing candle represents a high-quality setup.
Market context matters.
2. Ignoring the Overall Trend
A bullish signal appearing during a strong downtrend may be less convincing than one aligned with the broader market structure.
3. Entering Without Confirmation
Acting on incomplete setups can increase exposure to false signals.
4. Ignoring Risk Management
Even a carefully researched strategy can experience consecutive losses.
Using excessive leverage or risking too much on a single trade can quickly damage trading capital.
5. Constantly Changing Strategies
Switching strategies after every losing trade makes it difficult to evaluate performance objectively.
Instead, establish clear rules and test them consistently.
Is Price Action Trading Suitable for Beginners?
Yes. Price action trading can be a useful starting point for beginners who want to understand how financial markets move.
However, beginners should not expect immediate profitability.
Learning to identify support, resistance, candlestick patterns, and market structure takes time.
A practical learning approach is to:
- Study basic candlestick formations.
- Learn to identify support and resistance.
- Practice reading market structure.
- Test simple strategies using historical data.
- Practice with a demo trading account.
- Keep a detailed trading journal.
- Evaluate results before considering live trading.
Demo trading does not fully reproduce live-market conditions, particularly emotional pressure, slippage, and execution costs.
The objective should be to develop a repeatable analytical process rather than chase quick profits.
Learn Price Action Trading with Practical Chart Examples
Understanding trading concepts becomes easier when you study how they appear on real charts.
If you want to develop your price action knowledge further, structured educational resources can help you organize your learning.
Featured Trading eBook: How to Trade with Price Action
How to Trade with Price Action — PDF Edition
Explore a trading eBook focused on understanding price movements and developing stronger chart-reading skills.
This resource is designed for traders who want to explore practical price action concepts and learn through illustrated market examples.
Regular Price: $50.00
Current Offer: $25.00
Explore the Price Action Trading eBook at OLUXSO PRO TRADERS.
[Insert your direct product page link here]
Digital educational resource. Trading involves financial risk, and no strategy guarantees profitable results.
Frequently Asked Questions About Price Action Trading
What is the best price action trading strategy?
There is no single strategy that consistently performs best across all markets.
Support and resistance, breakout and retest, trendline trading, and market structure analysis are common approaches.
Their effectiveness depends on market conditions, execution, risk management, and the trader’s ability to follow a consistent process.
Can I trade using only price action?
Yes. Some traders use price action as their primary analytical method without relying heavily on indicators.
However, price action alone does not guarantee successful trading.
Risk management, transaction costs, and market conditions remain important.
Is price action better than indicators?
Neither approach is universally superior.
Price action provides a direct view of historical price movements, while indicators can help summarize trends, momentum, or volatility.
Some traders combine both methods.
Does price action work in Forex and Gold trading?
Price action principles can be applied to Forex and Gold markets.
However, these markets can experience significant volatility, particularly around major economic announcements.
A strategy should be tested separately for each market.
How long does it take to learn price action trading?
The basics can be studied relatively quickly, but developing consistent chart-reading skills and evaluating a trading strategy may take months or longer.
Learning speed varies according to experience, practice, and the complexity of the trading approach.
Can price action trading guarantee profits?
No.
All trading strategies involve risk, and financial markets are inherently uncertain.
Historical patterns may help traders analyze possible scenarios, but they cannot reliably predict every future price movement.
Final Thoughts
Price action trading provides a structured way to understand financial markets through candlestick patterns, support and resistance, trends, and market structure.
The seven strategies discussed in this guide offer a foundation for developing stronger technical analysis skills.
However, identifying patterns is only one part of trading.
Successful risk control, disciplined execution, realistic expectations, and consistent strategy evaluation are equally important.
The goal of learning price action is not to predict every market movement. It is to make more informed trading decisions using a clear and repeatable process.
If you want to explore price action trading in greater detail, discover our premium trading PDF eBooks at OLUXSO PRO TRADERS.
Build your trading knowledge one chart at a time.
Risk Disclaimer: Trading Forex, stocks, cryptocurrencies, commodities, and other financial instruments involves substantial risk and may result in financial losses. Leveraged trading can magnify losses. This article is for educational purposes only and does not constitute personalized financial or investment advice. Past performance does not guarantee future results.